The Effect of the Station Fire on Local Transportation
In Southern California, transportation is always of concern for the millions of people who live in the region. . A fire with such a large range as the Station Fire that swept through in late August and early September of 2009 had to cross several roads that people depend on for transportation. The Station Fire covered over 160,000 acres (“Station Fire”). This report analyzes how and why the fire spread the way that it did, which roads were affected, and if the fire hadn’t been contained, which roads would likely have been affected next. This report is intended for use in planning for future fires. Three maps are included with this report and referenced by their respective numbers. Map 1 is a reference map showing how the fire spread. The fire’s perimeter on each day from August 29, 2009 to September 2, 2009 is shown on the map. This map gives a spatial reference of the fire’s location within Los Angeles County. The fire spread from its original extent (August 29) primarily north and another branch spread to the east by the second day (August 30). The perimeter continued to expand to the east, north, and west until it reaches its final perimeter on September 2, 2009.
Some factors which influence the way that a fire spreads include aspect, elevation, and slope. Aspect, or the direction a slope is facing, affects the wind and solar radiation that the area experiences. This also has an influence on the humidity and fuel types in the region. South and southwest aspects encourage spread of the fire because they receive more solar radiation, resulting in higher fuel temperatures and lower relative humidity. The daytime upslope winds are also stronger on these slops (Long). Map 2 layers the fire perimeter from August 30 and from September 2 over a digital elevation model showing the aspect of the region affected by the fire. There is a large amount of south and southwest facing slopes within the perimeter of the spread. The region the fire did not spread to is dominated by east facing slopes. Therefore, it is very possible that aspect influenced the way that this fire spread. Another factor that influences the spread of fire is elevation. At high elevations, temperature is lower and precipitation and relative humidity are higher, all reducing the spread of a fire (Long). Because this region is in Los Angeles County, which is near sea level, this area is not at extremely high elevation and the spread of fire is not limited by these factors. Map 2 shows the Hill Shade of the region, and you can see that the region is hilly. Some areas in the fire's perimeter had higher elevations than others, which also may have influenced its spread. The final influencing factors is slope. Greater slopes increase the spread of fire because flames are closer to fuel upslope from the front of the flames, preheating the fuel (Long). The slope model in Map 2 shows that the fire’s region experiences a “High” level of slope, while the area south of the fire had a “Low” level. The terrain in the incidence report also describes this area as “steep and rugged” (“Station Fire”). Both of these sources indicate that the region has steep slopes, which likely influenced the fire to spread north. The fire’s spread can then be attributed to aspect, elevation, and slope, among other factors.
The roads and their relation to the fire are shown on Map 3. The major roads within the perimeter of the fire by September 2 include Big Tujunga Canyon Road, State Highway 2, and the Angeles Forest Highway. On September 10, the following roads and highways were closed: Santa Anita Canyon Rd to Chantry Flats is closed at Arno Dr., Aliso Canyon Rd at Angeles Forest Hwy, Big Tujunga Canyon Rd at Angeles Forest Hwy, Big Rock Creek Rd closed at Big Pines Rd, Highway 39 between San Gabriel Canyon Road and East Fork Rd, Angeles Crest Hwy between Big Pines Hwy and mile marker 26.7 north of Altadena, Big Pines Hwy at SR-2, and Cheney Trail at Angeles National Forest gate. These roads lay both within and outside of the limit of the fire perimeter, shown in Map 3.
Had the fire not been contained when it did, it would have likely continued to burn east. This would have affected a greater portion of State Highway 2. This is because the aspect of the area to the east is south and southwest, which encourages the spread of fire, and the terrain is still greatly sloped to the east. The fire was not likely to start spreading south, because the slope and aspect of the land to the south are not conducive to the spread of fire. Interstate 210 was close to the region where the fire started, but it remained safe because of its position south of the fire. This was fortunate, since shutting down an Interstate would inconvenience large numbers of people. The roads and highways to the north, northeast, and northwest of the original perimeter were in the burn area and were (and some continue to be) shut down. If the fire had continued burning north, Soledad Canyon Road and State Highway 14 would have been affected as well.
Part of the recovery process after the fire included rehabilitating the roads (“Station Fire”). However, the denuded landscape still threatens the safety of people using these roads. The Angeles Forest Highway and Big Tujuna Canyon Road were closed to the public months after the fire in January 2010 due to the anticipation of a large storm (KPCC). The status of the affected roads changes frequently. As of May 13, 2010, State Highway 2 from La Canada-Flintridge to Mount Wilson Road was closed to the public due to severe damage resulting from heavy rains. This section of highway is expected to reopen by mid to late Summer 2010. As repair work continues on the highway at lower elevations, the highway is open at higher elevations from Mount Wilson Road to State Route 138. County roads (Angeles Forest Highway, Big Tujunga Canyon Road, Upper Big Tujunga, etc.) leading to SR-2 are open to the public, but are construction zones, so drivers should expect delays (Chandler). Therefore, transportation continues to be affected by the Station Fire even months after it has been smoldered out. It is necessary that we be able to contain fires before they burn such a large area so that resources are not spent making repairs and so many lives are not inconvenienced.
Works Cited
Chandler, Patrick. “Angeles Crest Highway (SR-2) Repair Work Continues.” State of California Department of Transportation. 13 May 2010. 19 May 2010 http://dpw.lacounty.gov/CARE/files/caltrans051310.pdf.
Long, A. and D. Kennard. “Effects of Topography on Fire Intensity and Rate of Spread.” Forest Encyclopedia Network. 14 Nov. 2009. 19 May 2010 http://www.forestencyclopedia.net/p/p489.
KPCC. “County roads in Station Fire area to close in advance of rain.” Southern California Public Radio. 16 Jan. 2010. 19 May 2010 http://www.scpr.org/news/2010/01/16/county-roads-station-fire-area-close-advance-rain/.
KTLA. “Evacuation Info, Road and School Closures.” KTLA.com: Info. 10 Sept. 2009. 19 May 2010 http://www.ktla.com/news/landing/ktla-station-fire-evacuations,0,7123246.story.
“Station Fire.” Inciweb: Incident Information System. 10 Nov. 2009. 19 May 2010 http://www.inciweb.org/incident/1856/.

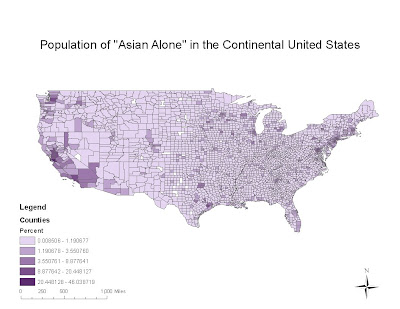
 The counties with the highest percentage of Asians are primarily located on the west coast. Seattle, the San Francisco Bay area, and the Los Angeles region all have relatively high proportions of Asian Americans. There is also a relatively high proportion of Asians in the New England region. The tendency of having a high proportion of Asian Americans seems to be linked with major cities. This is likely due to the fact that many Asian Americans immigrated to the United States for the purpose of working in industrial areas, and the spatial trend today still reflects that.
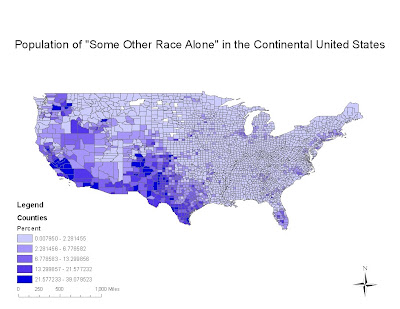
  Counties with a high proportion of people classified as "Some Other Race Alone" are primarily located in the southwest. Along the Mexican border on the southwest, there is the highest occurrence. This is likely due to the high proportion of Hispanic people of Mexican nationality in the region that do not consider themselves to be any of the other races listed. Counties that do not directly border Mexico but are still nearby also have high percentages of this category. The percentage decreases spatially from south to north in the western United States. The rest of the United States has low percentages of people in this category.

