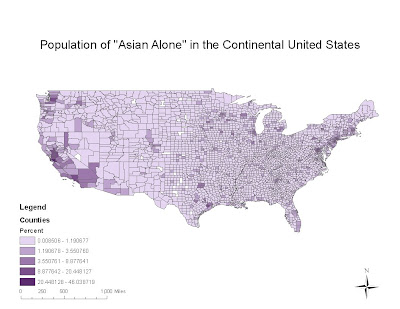
 The counties with the highest percentage of Asians are primarily located on the west coast. Seattle, the San Francisco Bay area, and the Los Angeles region all have relatively high proportions of Asian Americans. There is also a relatively high proportion of Asians in the New England region. The tendency of having a high proportion of Asian Americans seems to be linked with major cities. This is likely due to the fact that many Asian Americans immigrated to the United States for the purpose of working in industrial areas, and the spatial trend today still reflects that.
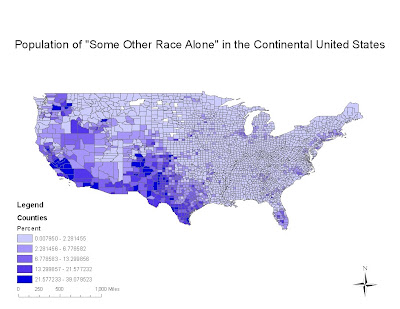
  Counties with a high proportion of people classified as "Some Other Race Alone" are primarily located in the southwest. Along the Mexican border on the southwest, there is the highest occurrence. This is likely due to the high proportion of Hispanic people of Mexican nationality in the region that do not consider themselves to be any of the other races listed. Counties that do not directly border Mexico but are still nearby also have high percentages of this category. The percentage decreases spatially from south to north in the western United States. The rest of the United States has low percentages of people in this category.
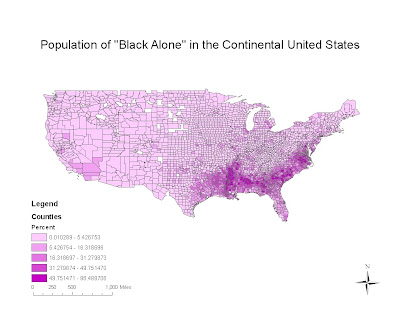
These three maps show spatial distributions of people classified for Census purposes as "Black", "Asian", and "Some Other Race". The general trends are that Asians are focused on the west coast, especially California, blacks are primarily in the southeast region of the country, and "some other race" along the Mexican border. Although there is not a specific map of Caucasians, the data from these maps could lead one to infer that the regions not specified as being associated with one of the previous groups are predominantly Caucasian. However, it is also important to note that these maps show percentages, not actual numbers. So, even though the largest physical area is predominantly Caucasian by percentage, these counties in the central part of the country have low population density and it would be misleading to assume that the total percentages of "black", "Asian", and "Some other race" in the country would resemble the distribution by county. A county like Los Angeles has far more people than a county of comparably physical size in Tennessee or Kansas. Nonetheless, these maps do allow us to see spatial patterns of how people of different groups are distributed, and it is evident that clustering does exist.
My overall impression of GIS is that it is very useful, but that it does have limitations. Using GIS we have been able to make interactive thematic maps, show the spread of a fire, make 3-D models of a region, and many other useful applications. What has struck me the strongest is that the mapmaker has so much power in regards to what the map conveys. Based on decisions that the GIS user makes, the data shown could be interpreted in very different ways. I think that GIS will continue to become more and more relevant in the private and public sector with increased access to shared databases. The field will continue to grow and find more and more applications. I was overall impressed with the user accessibility of ArcGIS and its associated software and I am looking forward to using it more in the future in advanced GIS classes.
No comments:
Post a Comment